
How is Australia tracking in meeting its educational goals of excellence and equity? How well are our school systems supporting schools to meet the needs of disadvantaged students?
The Mitchell Institute’s latest report, Years apart: Australia’s growing educational inequality, draws on 17 years of data from the National Assessment Program – Literacy and Numeracy (NAPLAN) to understand the extent of the learning gaps by student socioeconomic background across Australia and in each state and territory. It also examines what has been happening over time.
The study found clear and consistent learning gaps between advantaged and disadvantaged students, and that these gaps tend to widen as students progress through school. It also found that the performance of disadvantaged students in Australia is declining over time compared to the Australian average.
The research provides a comprehensive picture of how the system-level features of schooling may be affecting the work and capacity of schools to bring about equity in learning outcomes.
The timing of this study is important, given renewed commitments to achieving ‘excellence and equity’ in Australian schooling through the Better and Fairer Schools Agreement. These agreements between the Federal Government and all states and territories stipulate a renewed focus on lifting the performance and outcomes of disadvantaged students.
However, before moving forward, it is imperative that we understand the extent to which the policy aspirations for quality and fairness have been realised in Australia, and whether we are heading in the right direction.
The bottom line: disadvantaged students can be years behind the Australian average across year levels, whilst advantaged students can be years ahead – and these gaps are growing over time.
Key findings
There are large and persistent learning gaps between advantaged and disadvantaged students in Australia
- Our analysis of 17 years of NAPLAN data suggests that Australia is not tracking well in meeting its educational goals of equity and excellence.
- Between 2008 and 2022, advantaged students outperformed disadvantaged students at every year level in the reading and numeracy NAPLAN domains.
- Learning gaps between advantaged and disadvantaged students are generally larger in reading than in numeracy, especially in the primary school years.
- Learning gaps in numeracy are smaller in the primary school years and larger in the secondary school years.
- These learning gaps begin in Year 3 and widen as students progress through school, such that the largest gap is observed in Year 9. For example, looking at the average learning gap size in reading between 2008 and 2022, we find that Year 3 students with at least one parent with a bachelor’s degree or higher are 2 years and 3 months ahead of students whose parents have not completed school. By Year 5, advantaged students are 2 years and 10 months ahead, in Year 7, the gap is 3 years and 10 months, and by Year 9, more advantaged students are 4 years and 3 months further ahead in their learning.
- The enduring and persistent nature of these gaps suggests the issue is structural, rather than confined to particular years or the result of short-term factors.
Learning gaps increase as students progress through school
Average gap in Equivalent Years of Learning between more advantaged and more disadvantaged students by NAPLAN year level, parental background and domain, 2008 to 2022
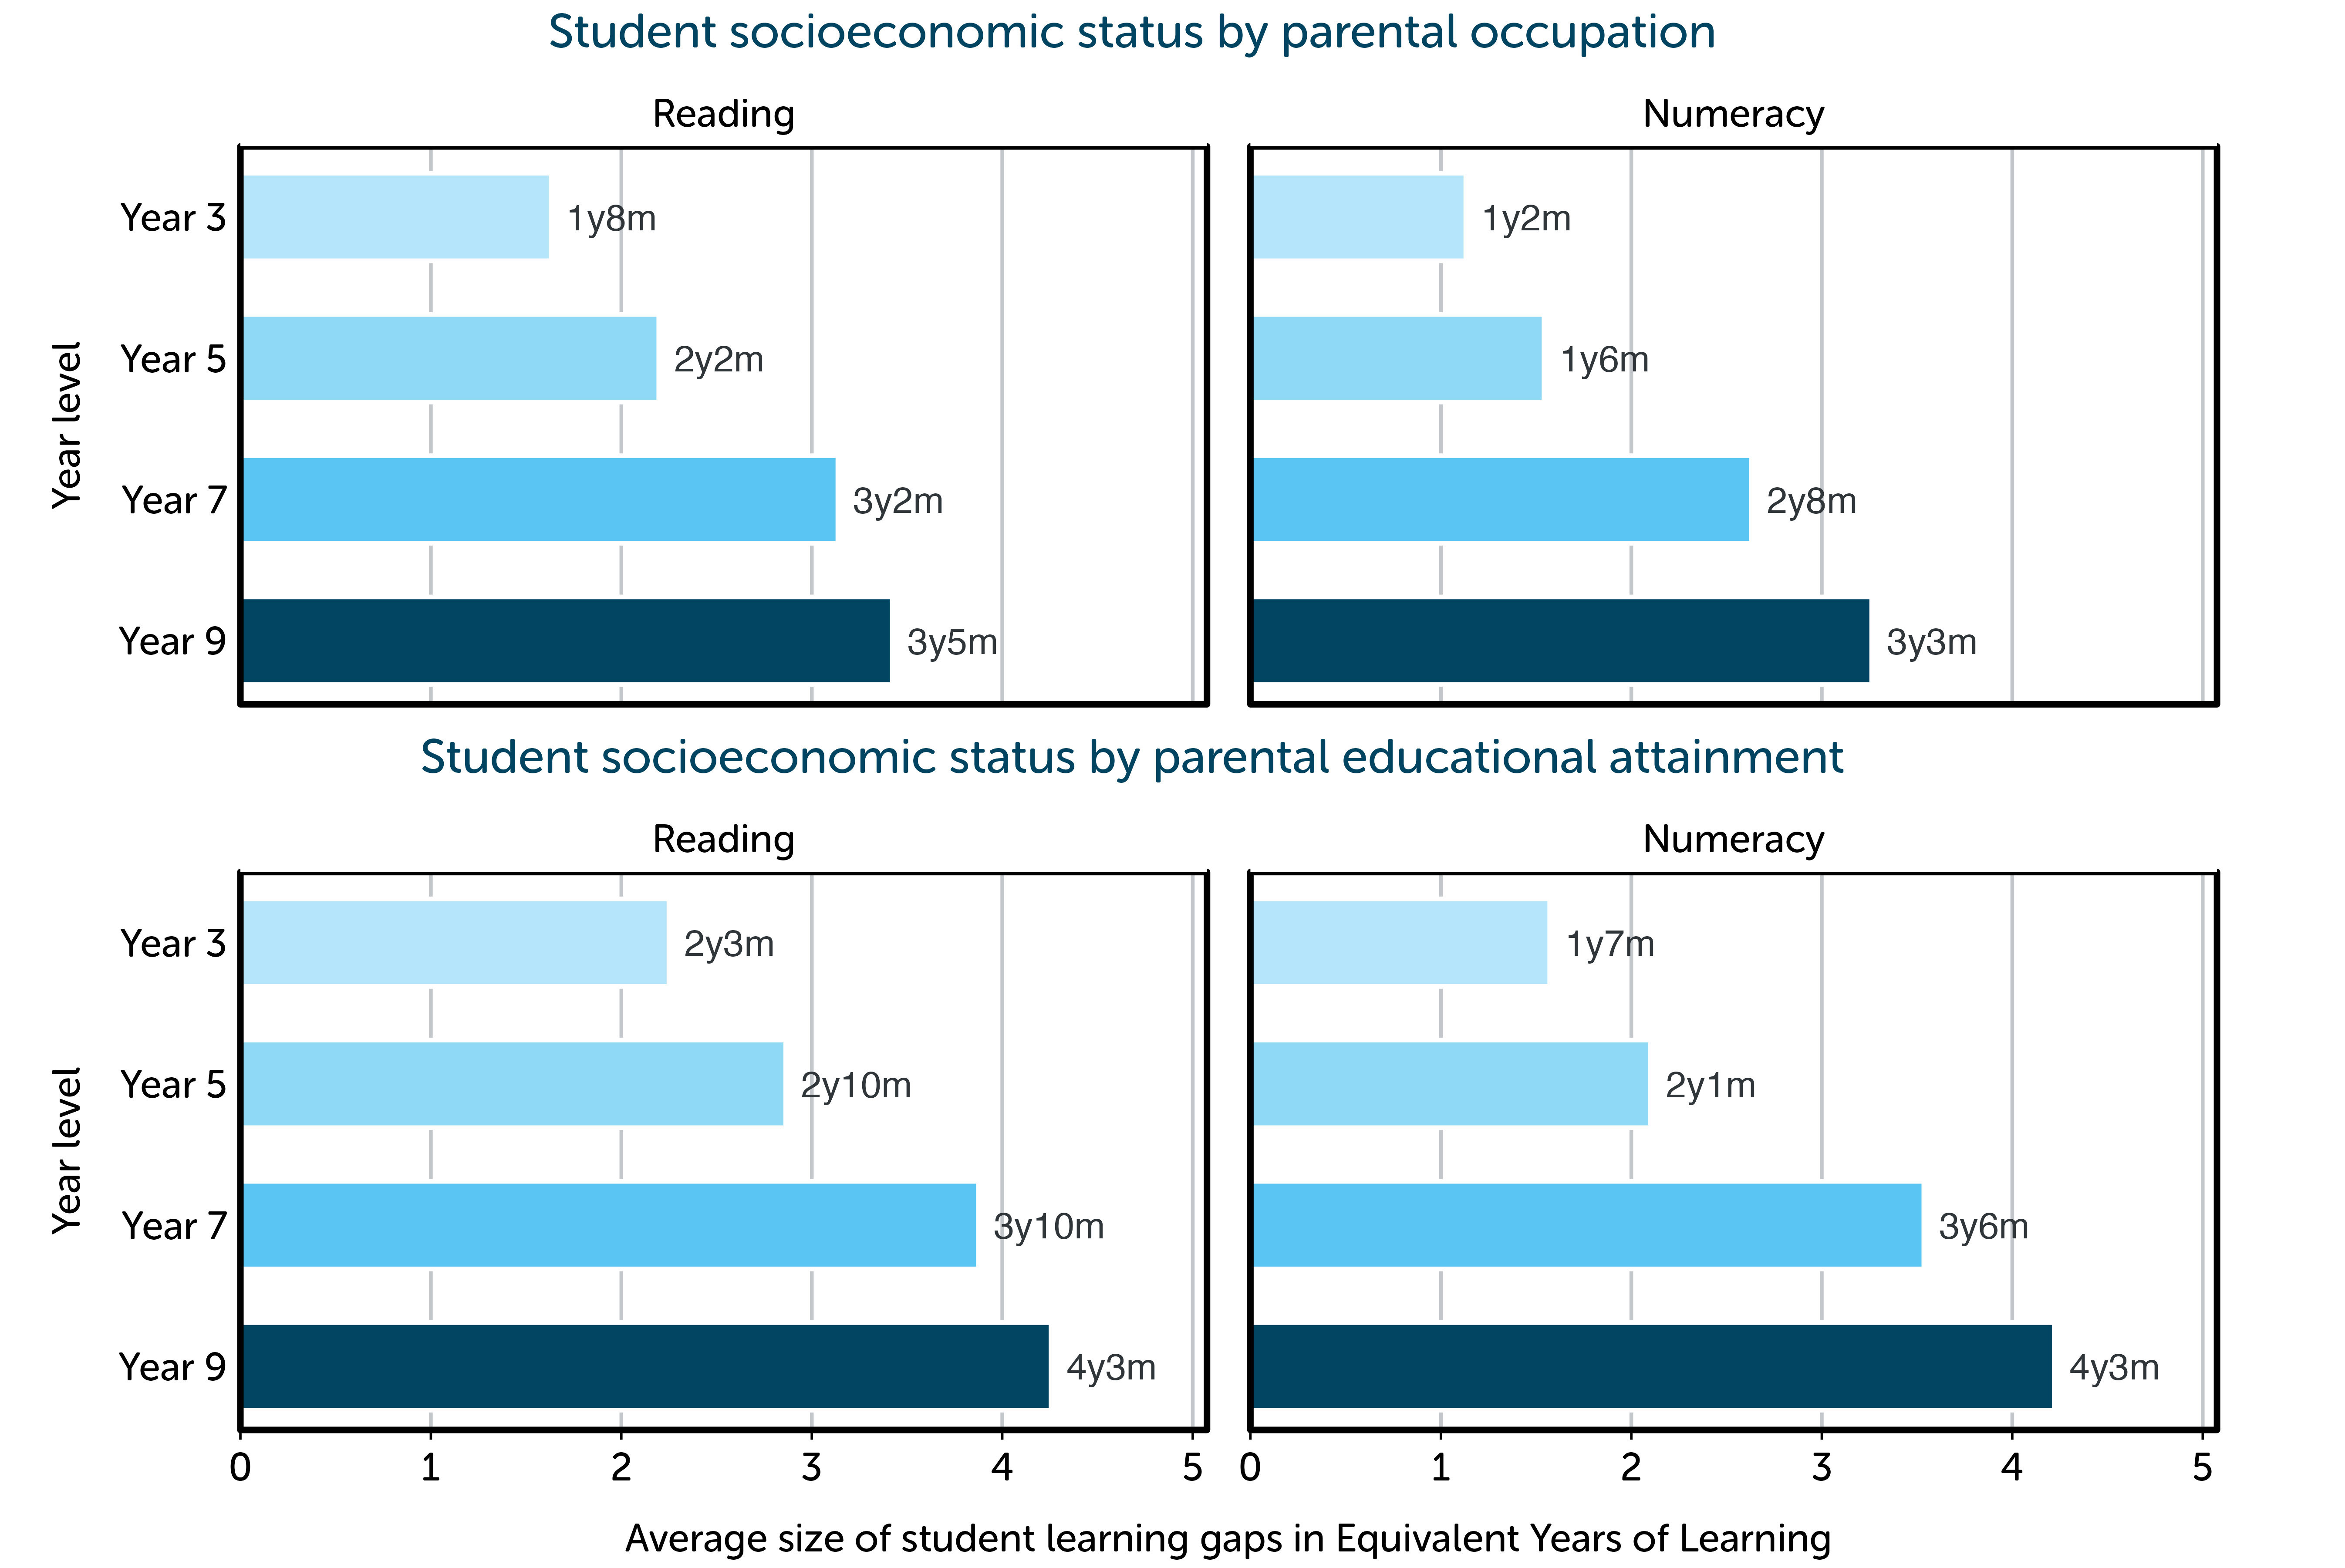
Source: Mitchell Institute analysis of ACARA data.
Note: Student SES by parental education uses ‘Bachelor degree or above’ for more advantaged students and ‘Did not complete school’ for more disadvantaged students. Student SES by parental occupation uses Group 1 for more advantaged students and Group 4 for more disadvantaged students.
Student inequality in Australia is growing over time
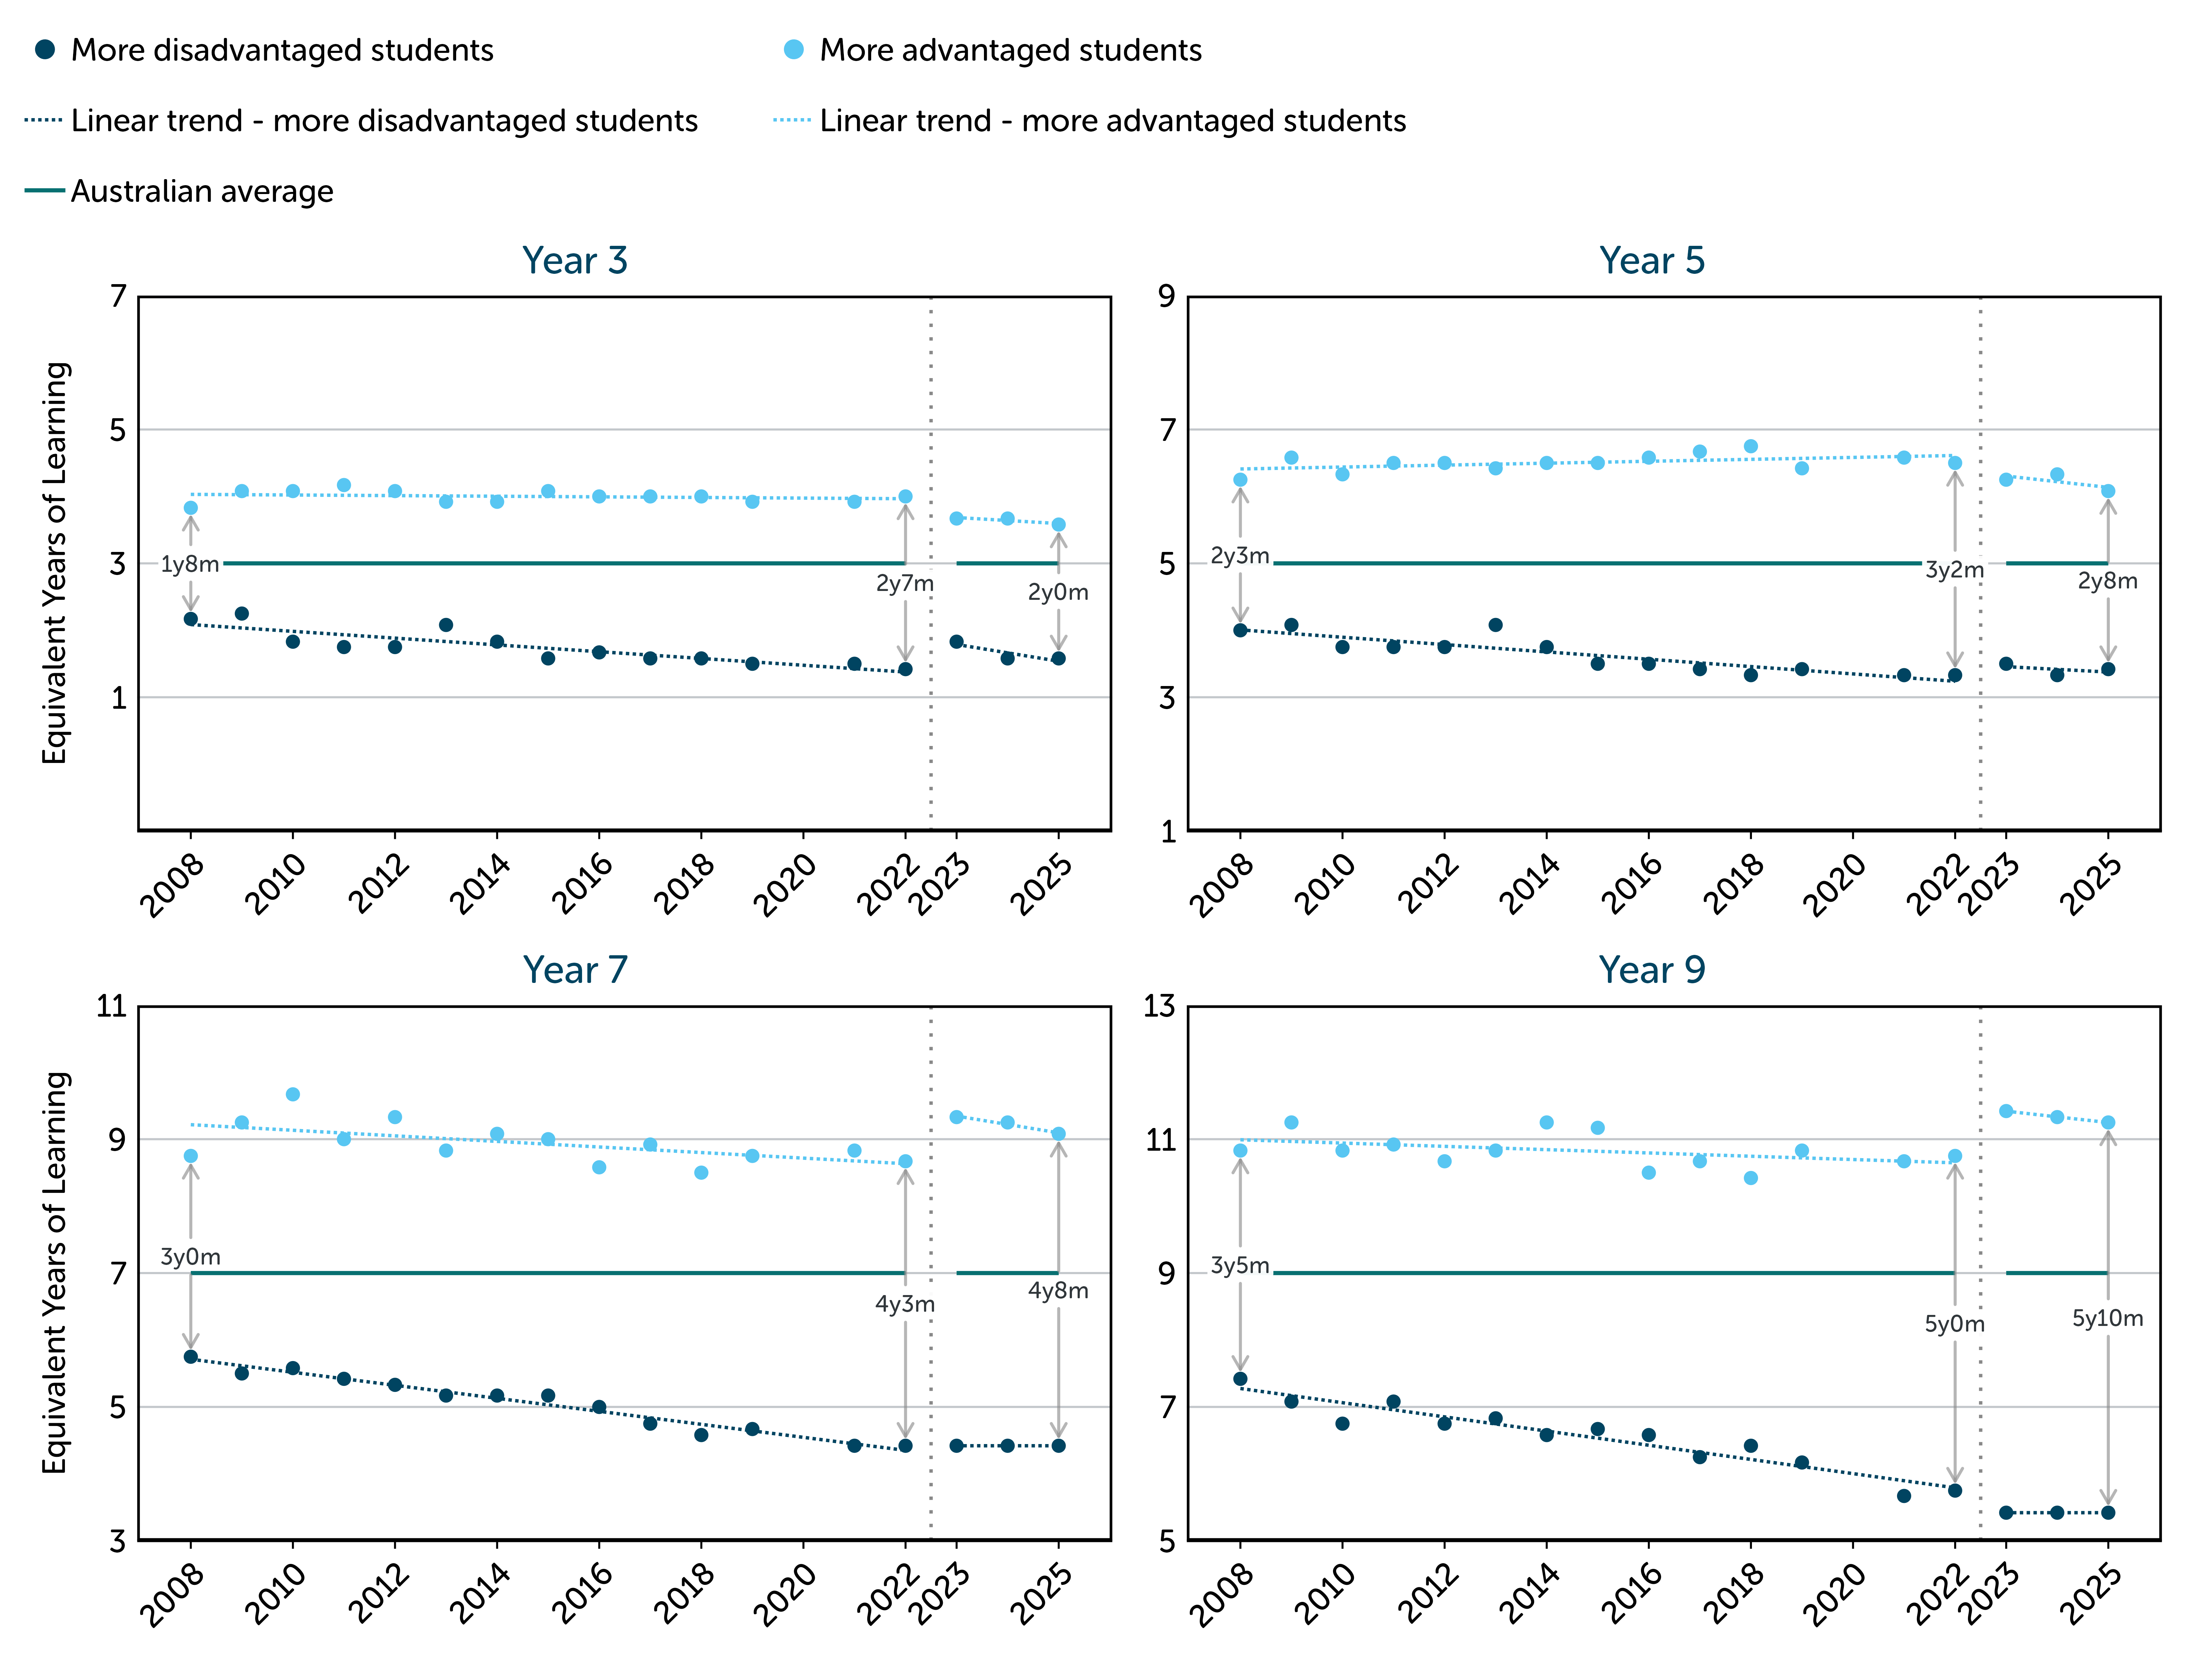
- Learning gaps between advantaged and disadvantaged students have widened over time in all year levels, both by parental education and parental occupation, except for numeracy in Year 9. For example, the learning gap in reading between Year 5 students whose parents had a bachelor’s degree or above and those whose parents did not complete school grew from 2 years and 3 months in 2008 to 3 years and 2 months in 2022.
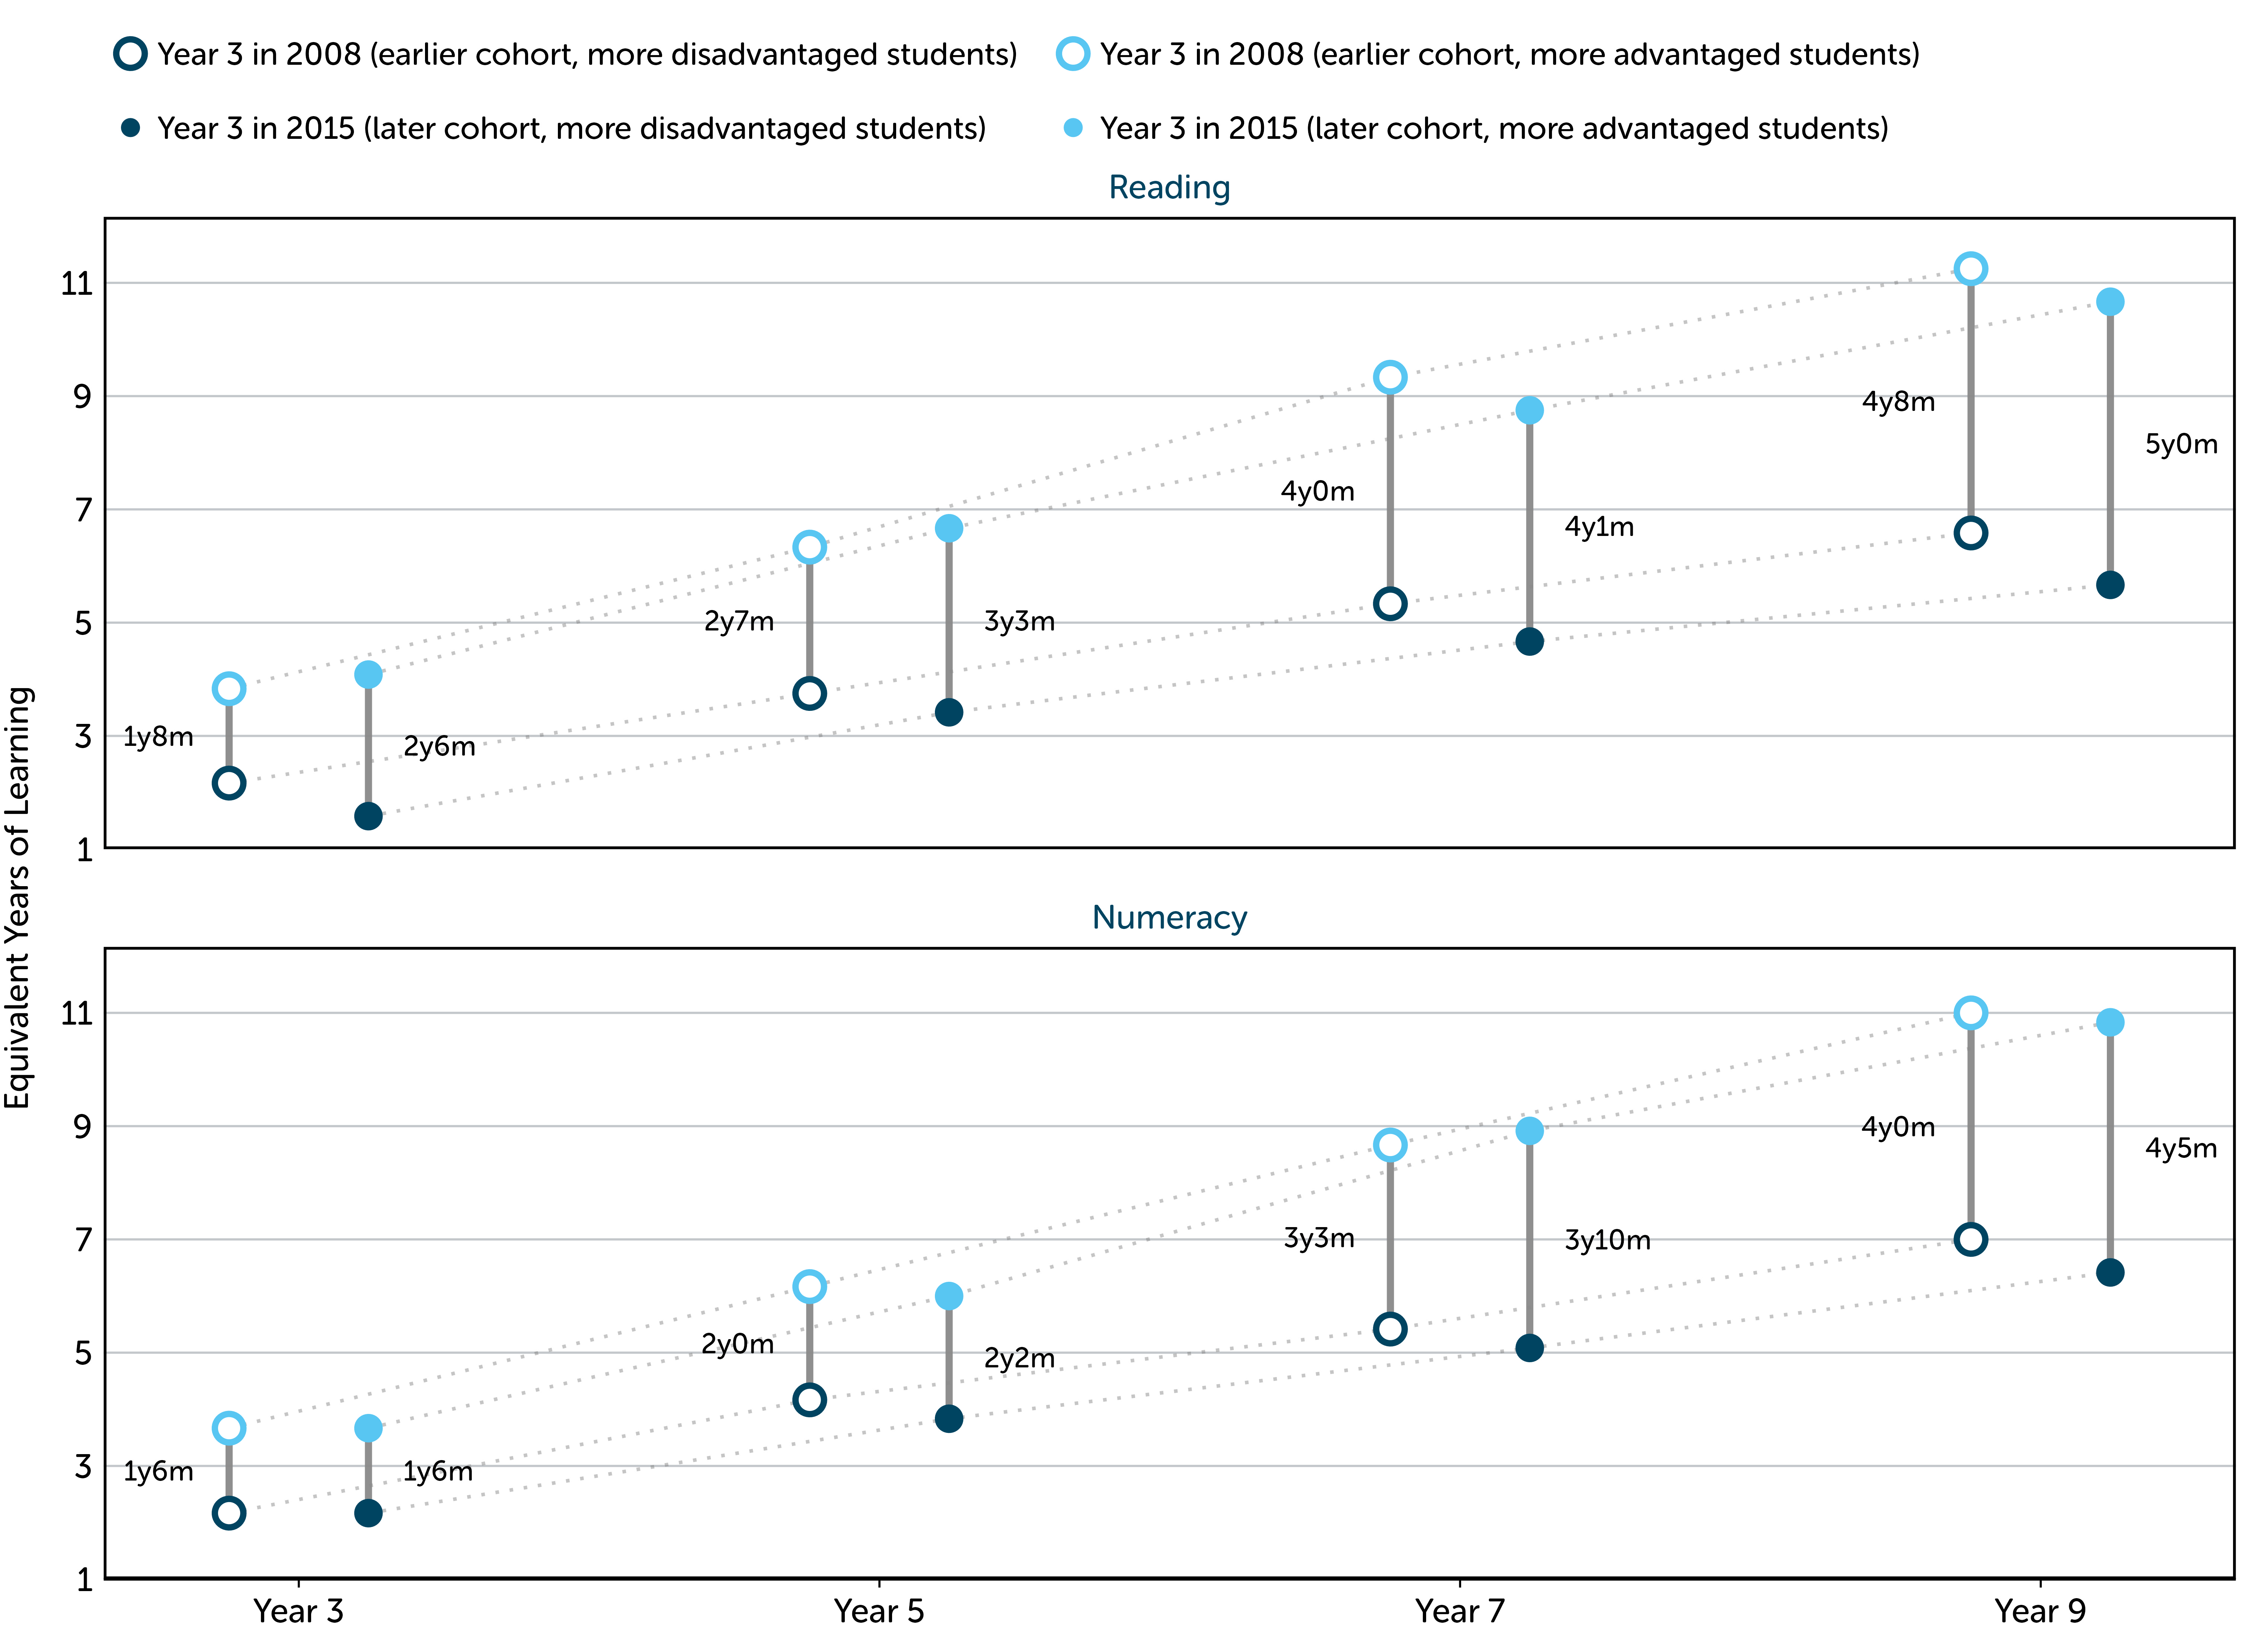
- Comparing two cohorts of students – an early group comprising Year 3 students in 2008 and a later group in Year 3 in 2015 – we find that there is greater inequality in outcomes in the later cohort compared to the earlier cohort, attributed to a greater decline in performance of disadvantaged students.
Student reading gaps by parental education have grown over time in all year levels
Equivalent Years of Learning for reading by student parental education and NAPLAN year level, 2008 to 2025
 Source: Mitchell Institute analysis of ACARA data.
Note: Student socioeconomic status uses the highest level of parental education (‘Bachelor degree or above’ for more advantaged students and ‘Did not complete school’ for more disadvantaged students). Dotted vertical line marks the NAPLAN time series break between 2022 and 2023.
Learning gaps widen as students progress through school and are larger in the later cohort
Reading and numeracy Equivalent Years of Learning and gaps between more advantaged and more disadvantaged students in two student cohorts by parental education, Year 3 in 2008 (cohort 1) and Year 3 in 2015 (cohort 2)
Source: Mitchell Institute analysis of ACARA data.
Note: Student socioeconomic status uses the highest level of parental education (‘Bachelor’s degree or above’ for more advantaged students and ‘Did not complete school’ for more disadvantaged students).
Disadvantaged students are faring worse over time
- The widening gaps in student learning outcomes that we see over time are driven less by improvements among advantaged students, and more by the negative effects of inequality on disadvantaged students who experience a decline in performance over time compared to the Australian average.
- Disadvantaged students are worse off in more recent years than their peers were in 2008. In reading, for example, Year 9 students in 2022, whose parents did not complete school, were almost 1 year and 6 months behind similarly disadvantaged students in 2008.
Despite some variation, there are large and growing socioeconomic gaps in most states and territories.
- The reading and numeracy results of low SES students have generally declined over time across most Australian states and territories. However, the pattern is not the same everywhere, and not all NAPLAN domains show the same level of decline.
- Among students whose parents did not complete school, reading performance has declined in every state and territory. The decline was steepest in Tasmania, the Northern Territory, and the Australian Capital Territory, but less steep in Queensland and Western Australia.
- Numeracy results for low SES students were more mixed. In Queensland primary schools and in Years 5 and 9 in Western Australia, students whose parents work in lower status occupations actually improved their average numeracy scores over time. In South Australia, the results for equivalent students remained relatively stable.
Why does this matter?
If the high-level goals of the Australian school systems are ‘equity and excellence’, then our analysis of 17 years of NAPLAN data suggests that Australia is not tracking well.
We see that learning gaps between advantaged and disadvantaged students are large and persistent across the nation, and are a feature of every Australian jurisdiction. What’s more, these gaps do not close with increasing years of schooling but instead widen from Year 3 to Year 9.
Perhaps the most alarming observation is that this trend is intensifying in more recent cohorts of students. Learning gaps by student socioeconomic background are widening as disadvantaged students fall further behind.
The persistent low performance of disadvantaged students signifies that disadvantaged schools are struggling to meet the needs of their students, not because individual teachers or the schools are failing, but because of system level factors that are leading to increasing inequality in outcomes over time.
Over the years, Australian education policy has addressed equity primarily through targeted approaches focused on students and schools, often neglecting the systemic drivers of inequality, but the magnitude and growth of educational inequality shown in this study suggest that the current approach falls well short of what the challenge demands.
Without a system-level approach, the inequality will continue to undermine the ability of our education systems to meet the goals of equity and excellence. The system-level architecture is a major driver of inequality in student outcomes in Australia, and it is at the system-level that we see opportunities for real change.